How to use the chart for positions within a price range?
With the chart for positions within a price range, showing you both the current pool tokens’ prices and your position’s details for different periods of time, you can always track the amount of time your position was in a range. It is available on our dApp. Here’s what you need to know about the chart.
- How do I know that my position is in range?
If the price curve crosses the colored field at the current moment, it means that your position is in range. Otherwise, the price got higher or lower depending on the direction of the price curve, and your position for out of range. Keep in mind that the X-axis of the table represents the timeline, while the Y-axis shows the prices of tokens.

- Is It possible to track the moment of closure of a position?
The closure, as well as the reopening of your position, is also displayed. You can trace this on the X-axis, which represents the time segment. If the colored field breaks off, the position has been closed.

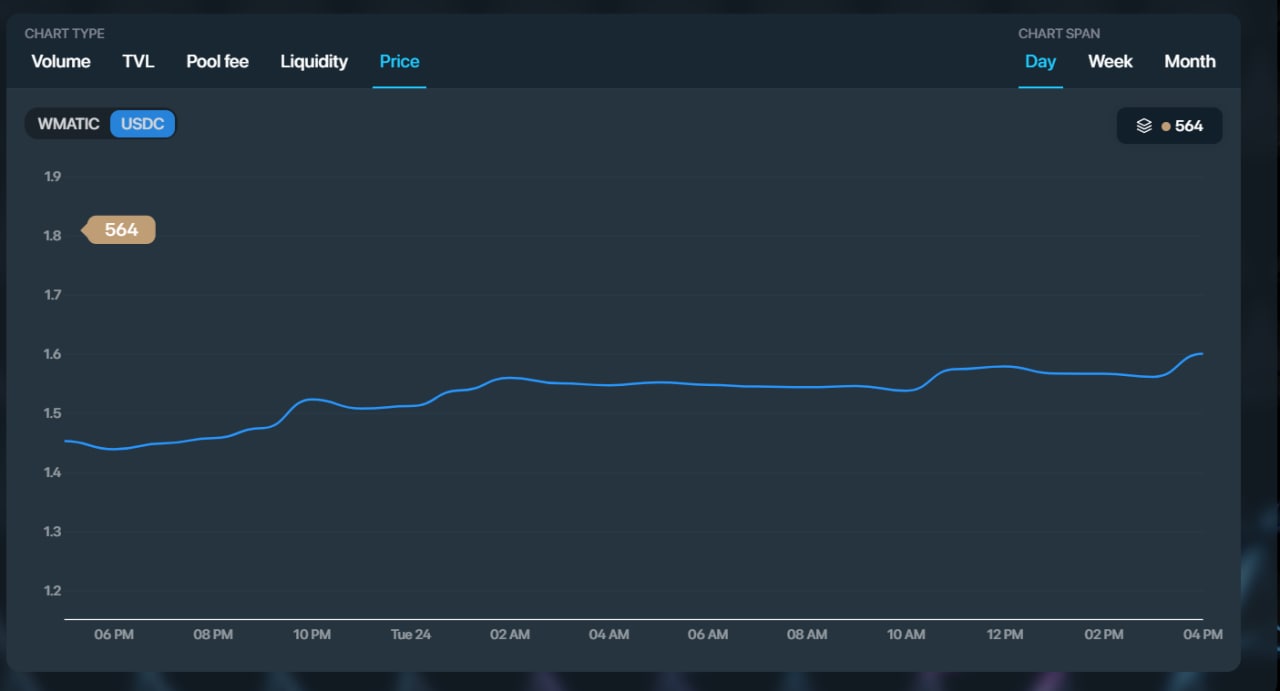
- Why is my position not displayed?
If the field of your position isn’t displayed, and all you see is a number of the exact position, then the graph does not contain the interval on which the position is placed due to the change in the min or the max price of a token.

If your position was active during a month, i.e. was in range, but isn’t displayed in both Daily and Weekly periods, then it will be shown in the Monthly period.
So, to see the period of time that your position was in range, all you need to do is to tap on “Month” in the upper right corner. It looks like this:

- How do I see the data for different positions opened?
If you have multiple positions, the colors of their fields differ regarding the number of positions and the color of the position’s round logo. To choose an exact position, click the button under the time periods – Day, Week, and Month – and click the position you would like to be displayed.
That is all you need to know regarding the table displaying the current state of your positions. Check them out on our dApp anytime.